
Meet three Americans bearing student loan debt.
The first is a newly minted Harvard MBA. He owes $300,000. He has just accepted a compensation package worth $350,000 a year. He will repay his loans in roughly the same span it takes most people to select a paint color.
The second earned a four-year degree in a “studies” field from a college whose career-services office ended up being a fiction. She owes $20,000, works as a retail clerk, and has no clear path to earning the kind of income that would extinguish the debt. She defaulted years ago and has been pursued by collectors ever since.
The third is the unemployable graduate of a for-profit college that collapsed under DOJ scrutiny for fraud. She owes $3,000. The training she paid for prepared her for a career that did not exist in the way the brochure described it.
When you read that 42.8 million Americans hold roughly $1.7 trillion in federal student debt, you are reading a sentence that fuses those three people into one story. You are also reading a sentence that can be deployed to argue for almost any policy you fancy—from forgiving the MBA’s $300,000 because debt forgiveness is “popular,” to widening federal lending so the next cohort of students can shoulder even higher tuition at schools built to capture the loans.
This kind of conflation is the quintessential move in today’s affordability rhetoric. Catastrophic situations affecting a tiny share are blended with milder discomforts affecting vast numbers, and the resulting mix is labeled a crisis. The numbers swell because the categories are elastic. Then policy interventions are justified that, more often than not, worsen both the small acute problem and the large mild one.
There are real affordability problems in the United States. Two of them, by our reckoning. The rest is noise, and the noise is doing a lot of political heavy lifting—for both parties, in different ways. None of it yields good policy and most of it makes the genuine problems harder to solve.
Most affordability writing sorts Americans by income decile or sorts the world by service category—the costs of housing, healthcare, or childcare. We are doing something different. We are sorting Americans by the kind of trouble they actually face. There are two groups truly in trouble: a destitute tail that is small and brutally squeezed, and a much larger, squeezed-talent class that is doing everything right yet cannot replicate their parents’ material life. Everyone else is okay, or okay enough, or in trouble we are not obliged to call a crisis. The two groups require opposite remedies, and the notion of a single homogeneous affordability crisis makes that distinction invisible.
The ‘49 percent.’
In March 2026, Urban Institute released an updated measure called the True Cost of Economic Security. The headline is that 49 percent of people in American families lack the resources needed for economic security. The Urban Institute, careful in referring to “economic security” rather than survival, notes that more than 40 percent of those below the threshold are between 75 and 100 percent of it—“largely getting by, meeting most regular expenses, but not positioned to thrive.” Yet the coalition that commissioned the report—the National True Cost of Living Coalition—and the press coverage weren’t as careful. Fortune in March: “Half of Americans can’t afford to dine out or vacation in a cost of living crisis.” Governing: “Nearly Half of U.S. Households Are Not Economically Secure.” The Community Service Society of New York, one of the report’s commissioners, proclaimed: “More Than Half of All People in U.S. Lack Economic Security.” The careful researcher’s number becomes the activist’s slogan becomes the political claim.
If that were true, you would expect to see it manifesting in obvious hardship. You would expect mass hunger, or at least mass migration. You would expect the streets to be filled with the dispossessed. What you actually observe is a nation whose biggest dietary problem is obesity and whose biggest housing problem is that no one is allowed to build much of anything. So what is the 49 percent actually measuring?
The threshold is defined as the level of resources required to fully participate in today’s economy and society without cutting back on anything, while also saving for emergencies and the future.
To fail this test, you do not need to be hungry. You do not need to be cold. You do not need to be one car-repair away from homelessness. You need only to be sacrificing something. Or not saving as much as some Urban Institute economist thinks you should.
By that standard, the Harvard MBA from our opening vignette fails the test. He’s spending the full $350,000, and more, because he just bought a Manhattan co-op and his partner wants a destination wedding. He is cutting back—on dessert at Per Se. He is not saving for the future. By the True Cost of Economic Security definition, he belongs to the 49 percent who cannot afford to live.
So, too, is a retired couple in Florida who are deliberately drawing down their savings, which is what savings are for. So is a 23-year-old barista spending every nickel on rent and concerts and living large. So is the unemployed-for-good woman with the valueless degree from the fraudulent for-profit college who is choosing between insulin and electricity in rural Mississippi.
One number. Four wholly different stories. The number is engineered to encompass all of them because including all of them yields the 49 percent. Even taken at face value, that figure does not expose the share of Americans truly in distress. It tells you the share experiencing any degree of financial squeeze, of any severity, for any reason.
The two real problems.
There are two serious affordability problems in the United States. They bear little resemblance to each other and demand opposite remedies.
First, the destitute tail. A real but small segment of Americans faces genuinely dire financial circumstances. They have more bills than money. They are one missed paycheck from eviction. They often have literally zero cash. The unemployable woman with the worthless degree from the fraudulent for-profit college falls into this category. So does the 58-year-old who lost a factory job, burnt through savings, cannot get back into the workforce, and watches his spouse work double shifts at Walmart.
These people require money. The entities that exacerbate their hardship—the for-profit schools that churn out unemployable graduates, and the medical-billing labyrinth that tricks people into paying twice—need to be curbed or eliminated. Both assertions are true, and neither remains seriously disputed politically.
The second problem is the squeezed-talent class, and it is harder to explain because the people involved appear fine on paper. Picture a 32-year-old physician married to a 32-year-old software engineer. Combined household income, $400,000. They cannot buy a house in San Francisco, Boston, or New York within a sane commuting radius. They cannot afford three kids, child care, and decent schools. They are doing every single thing the meritocratic American dream told them to do, and the dream isn’t delivering. Their parents, at the same age, with worse credentials and lower real incomes, owned a house and had three kids on one salary. Something is broken here, and it isn’t their fault, and it isn’t fixed by transfers. Giving this couple a $5,000 childcare credit doesn’t budge the needle on $4 million houses—and, worse, by inflating demand for childcare without addressing supply, the credit makes childcare more expensive for those behind them in line. The right tends to dismiss this couple as coastal elites complaining. The left tends to dismiss them as already in the top 5 percent. Both are wrong. This is a fundamental talent-allocation problem, and the country pays a real price when its most productive young people cannot form families or live near their work.
These two problems require entirely different policy responses. The first is a redistribution challenge, calling for cash transfers, safety nets, and crackdowns on the worst bad actors. The second is a supply problem, calling for zoning reform, licensing reform, and a dismantling of entrenched cartels in housing, healthcare, education, and childcare. The policy packages do not overlap.
This is where the affordability discourse goes off track, and where both political coalitions err. Democrats push policies nominally aimed at the destitute tail—childcare subsidies, student-loan forgiveness, ACA expansion—that largely pass through to the squeezed-talent class while driving up prices for everyone. Student-loan forgiveness is, by construction, regressive: those with the largest balances are those who pursued graduate studies and expect the highest lifetime incomes. Childcare subsidies disproportionately aid dual-earner professional couples, and where subsidies are greatest, prices have risen the fastest. Republicans advocate tax cuts and deregulation that primarily aid asset owners and high earners, plus, more recently, tariffs and targeted industrial policy that hurt the destitute tail by pushing up prices. In short, both parties subsidize the upper middle class while assuring everyone their help is going to the poor.
The grab bag.
Now let’s look at what people actually tell pollsters about what bothers them. The responses cluster into three tiers, and only the third qualifies as “noise” in any strict sense. The top tier is food and gas. These dominate every recent open-ended poll by a wide margin. CNN’s May 2026 survey found that the share of Americans spontaneously naming gas prices as their top economic problem jumped from 5 percent to 23 percent in a single year, with food costs cited nearly as often. The University of Michigan’s consumer sentiment index hit a record low in May, with the director attributing the drop to the oil-supply shock from the Iran conflict. Bureau of Labor Statistics data show energy up roughly 18 percent year over year and gasoline up 28 percent. These are commodity stories, not a structural cost-disease story. They are real and they hurt, especially the destitute tail. But for anyone not desperately poor, what they impose is temporary budget pain and pessimism, not a structural experience of being priced out of a life. We do not pretend they don’t move political opinion.
The second tier consists of structural items—housing, healthcare, childcare, and education. In open-ended polling, these appear less frequently than food and gas: Gallup’s April 2026 survey asks respondents for their most important financial problem; housing is 13 percent and healthcare 8 percent. This is affordability, but specific affordability for particular, relatively small groups.
The third tier is the long tail of grievances that fills out the rest. These do not show up in reputable polls, but they surface in focus groups, op-eds, and, crucially, in the survey responses that drive the 49 percent figure. Examining them is revealing, because this is where “affordability” ceases to mean what it sounds like.
Streaming services. Yes, really. The same households that once paid for cable, long-distance service, and a video-rental club in 1995 now complain about their growing stack of $5 streaming bills. This is a discretionary substitution. It is also a quality-of-life upgrade their grandparents could not have imagined.

Restaurant prices and tipping. Real, irritating, and in some cities outrageously high. Americans spent about 43 cents of every food dollar in restaurants in 1990; by 2025, that share had climbed to 56 cents. The grievance about restaurant inflation is, in large part, a complaint about a voluntary change in behavior.
Travel for youth sports. “My kid’s club soccer costs $4,000 a year.” Yes, and it’s optional, and it didn’t exist in your childhood, and your child isn’t likely to play in the World Cup.
Pet healthcare. It has indeed risen substantially, and people genuinely suffer because of it. Also, it’s a discretionary luxury that many households never would have afforded in the past. The MRI for the dog simply wasn’t part of the budget back then. Do people suffer more because this option now exists but is costly?
None of this belongs in a serious policy debate. All of it surfaces in the survey responses that feed the headline affordability numbers. When 49 percent of Americans say they cannot live securely, a meaningful slice of them is reporting a choice between Disney+ and Netflix.
We don’t say this to mock. (Well, perhaps a touch of affectionate mockery, but with care.) We say it because lumping together the 23-year-old who’s furious about streaming bundles with the 58-year-old former machinist who can’t afford insulin constitutes a category error. They are not facing the same problem. The first needs to mature; the second needs real help. It is possible to be deeply sympathetic toward the second while taking a wry view of the first; in fact, taking affordability seriously requires it.
A working taxonomy.
If we are to discuss affordability honestly, we must separate the actual problems by the kind of problem each one represents. There are roughly four categories.
The first is cheap to fix. Predatory subprime products—the for-profit colleges that yield unemployable graduates, the payday lenders, local governments using fines as revenue, surprise out-of-network billing, certain licensing regimes. Many of these are resolved not by more spending but by eliminating the bad practices the government already tolerates or by outlawing certain business models. These are easy wins. They have remained unaddressed because the few who benefit from the status quo are organized and persistent, while the many who suffer are diffuse.
The second category is worth real money. Pediatric healthcare for poor children. An expanded earned income tax credit. Targeted housing vouchers and subsidized childcare for working low-income parents—in places where supply can respond. These expenditures yield real outcomes—provided, and this is the critical caveat, the supply side is allowed to respond. Subsidies simply bid up prices if supply is artificially constrained.
The third category is “people should handle it themselves.” Lifestyle creep. Goods tied to social comparisons. Optional enrichment activities for children. The choice to live in the country’s priciest ZIP codes. The choice to pursue a degree with a clearly negative net present value when a candid cost-benefit calculation was available. These are not policy problems. They are adulthood. Labeling them as the “affordability crisis” is a subtler form of cultural infantilization, and we are not required to accept the framing.
The fourth category comprises genuinely hard structural problems with no cheap fix. Housing in productive coastal metros. Eldercare. The cost-disease sectors generally—healthcare, higher education, anything where Baumol’s curse (rising salaries without productivity gains) collides with regulatory cartels. These will not be fixed by a single intervention because the political coalition that benefits from the status quo is large and locally entrenched. Housing in San Francisco will not become affordable until incumbent homeowners accept that the common good requires slower house-price growth, which is to say, probably never. They got rich by closing the door behind them, and they would like that door to stay closed.
The two real affordability problems map to two separate boxes. The destitute tail needs the cheap fixes plus targeted real-money transfers. The squeezed-talent class needs the structural fixes, which are not cheap politically even when they are nearly free fiscally. Almost everything else either fixes itself or should not be fixed.
The part nobody mentions.
Here is the move the affordability discourse executes most quietly. The implicit assumption in nearly every affordability narrative is that we are starting from year zero. That the problem has been ignored. That no one has tried to do anything about it. That If Congress would only act, things would improve.
Congress has been acting. Continuously. For decades. On every one of these problems.
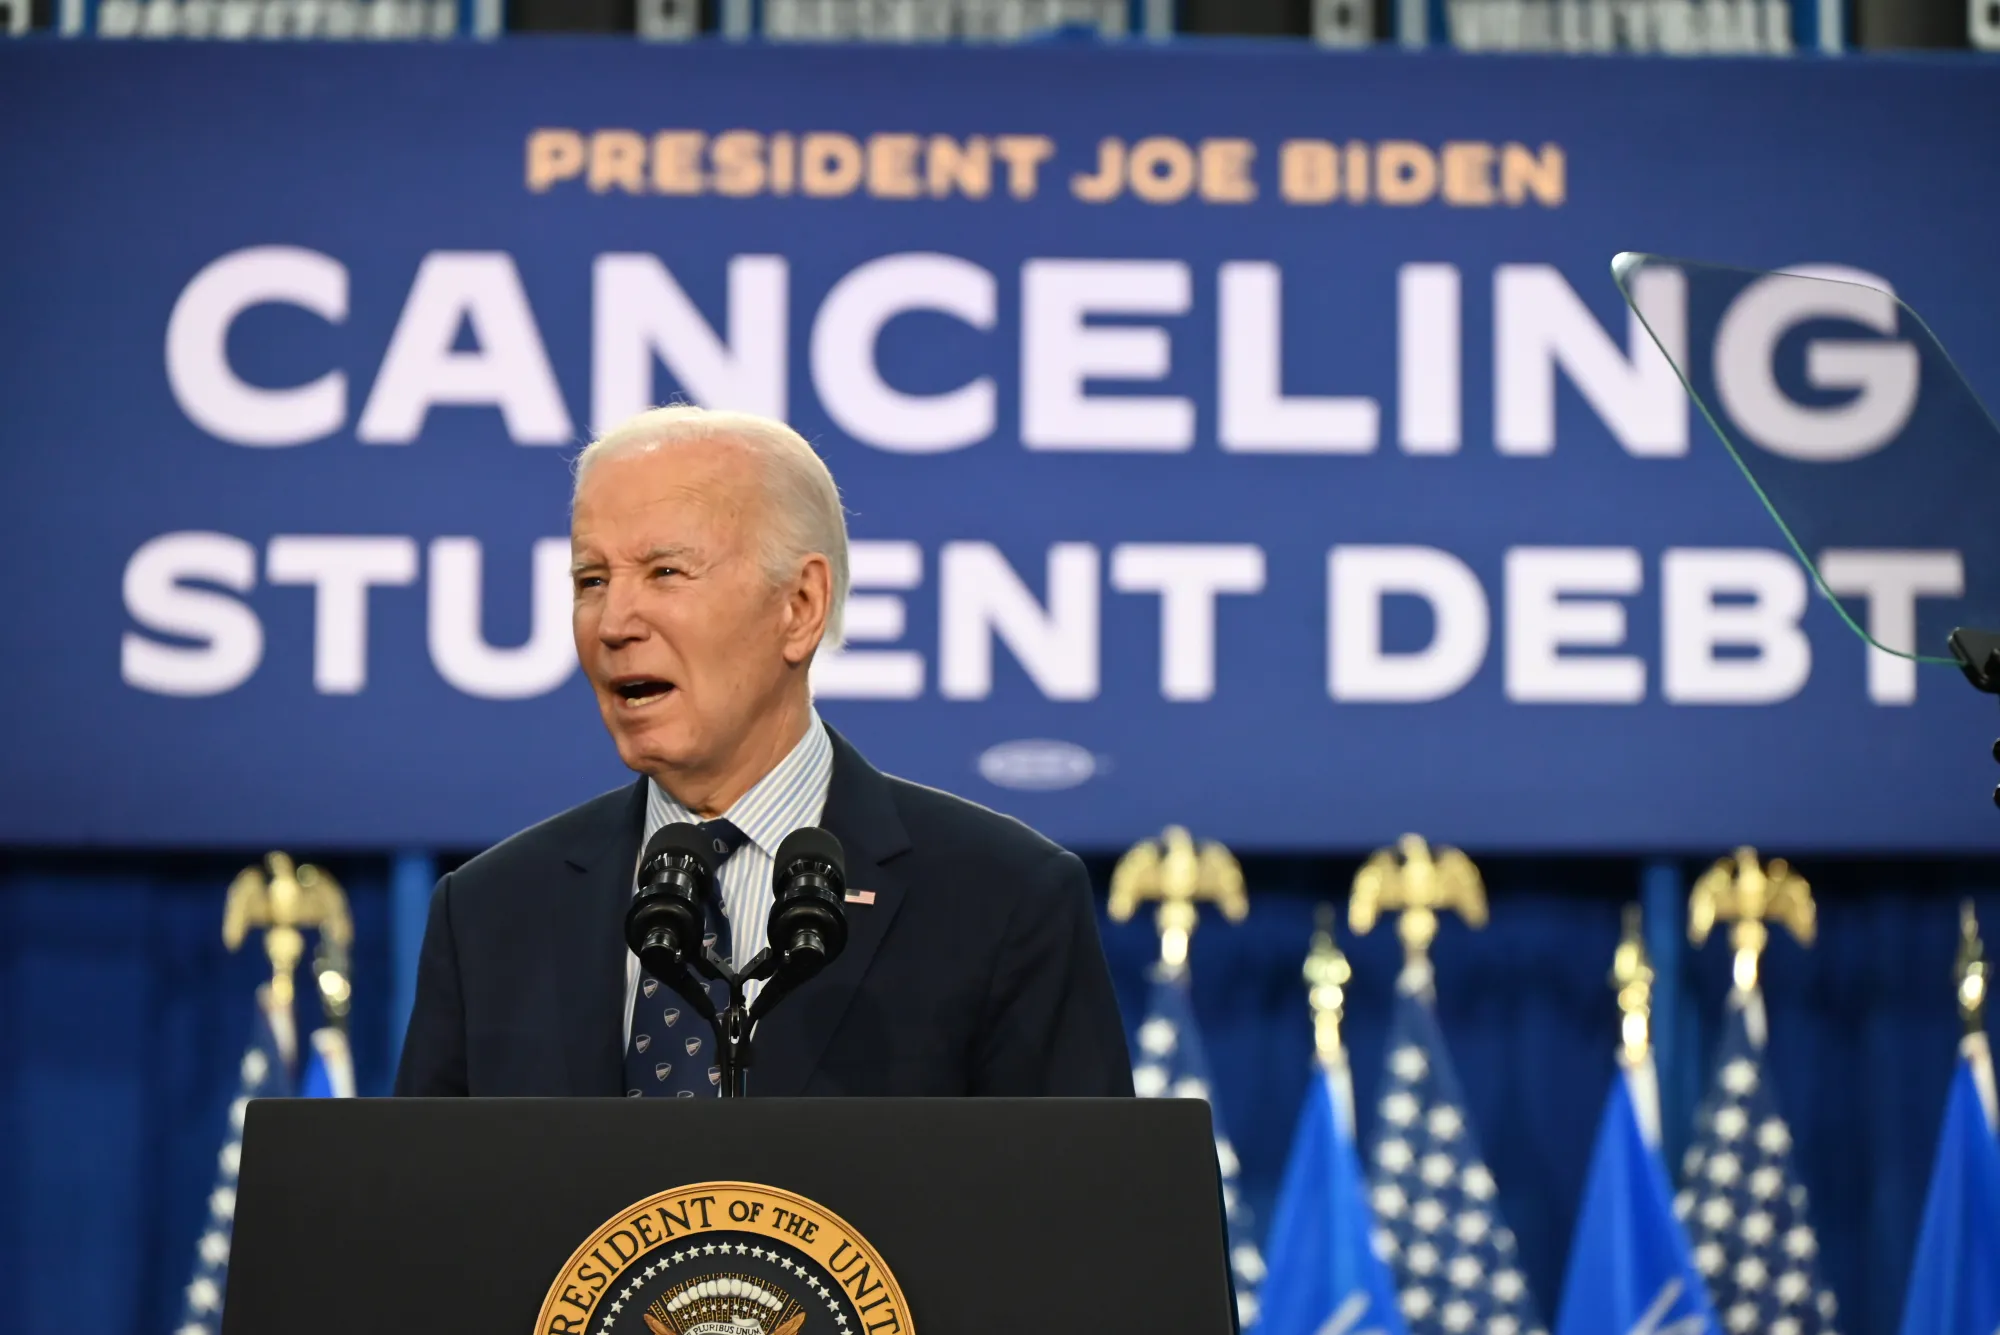
Take student loans, for example, where we began. The federal government has been “addressing” student-loan affordability since the Higher Education Act of 1965. Pell Grants in 1972. Expanded loan eligibility in 1978 and 1992. Income-based repayment in 1994 and again in 2009. Public Service Loan Forgiveness in 2007. The federal takeover of the entire loan program in 2010. The SAVE plan in 2023. Broad-based forgiveness attempts from 2022 through 2024. The cumulative federal effort across six decades amounts to trillions in subsidies, forgiveness, and foregone interest.
And what occurred as a result? Tuition rose at roughly twice the general inflation rate during the entire period of “making college more affordable.” The standard explanation is that subsidizing demand for an inelastic good drives price up to capture the subsidy. Schools raised tuition because students could borrow more. Students borrowed more because tuition rose. Aid rose to chase the price. The price rose to absorb the aid.
If you want the mechanism on display, here it is. In 2025 Congress established a $100,000 lifetime cap on federal borrowing for graduate students, effective July 1, 2026. Within weeks, UC Irvine’s Paul Merage School of Business cut its Flex MBA tuition by $30,000—landing at exactly $99,000—and announced the new price with marketing copy that, without apparent irony, stated, “University of California MBA is priced within reach of government loan limits — making a world-class degree not just aspirational, but truly attainable.” The school did not require econometric identification. The school had a price-setting algorithm and a federal loan cap, and it set the price to the cap. Even the administration that designed the cap conceded the mechanism: The stated rationale was that “unrestricted borrowing led to steep increases in graduate school tuition.” This is the Bennett hypothesis exposed in real time.
This is not a secret. It has been documented by the New York Federal Reserve, by Beth Akers, by virtually anyone who has examined the data without an axe to grind. Yet the affordability discourse cannot metabolize the finding, because the finding implies that the standard policy menu—more aid, more forgiveness—is itself the cause of the problem, not the solution.
Healthcare fits the same pattern on a larger scale. The ACA. Medicare Part D. Medicaid expansion. CHIP. COBRA. HSAs. The employer-sponsored health-insurance tax exclusion, which by dollar value is the largest healthcare subsidy in the federal code and has quietly boosted both demand and prices since 1943. The No Surprises Act. Hospital price transparency. The Inflation Reduction Act’s drug-pricing provisions. The federal government has undertaken a great deal on healthcare affordability in the last 25 years. Some of it worked. Medicaid expansion clearly reduced uninsurance. The ACA marketplaces stabilized what had been a collapsing individual market. Some of it failed. The cheapest Silver plan on the ACA marketplace has risen 77 percent since 2017, which Urban Institute trackers highlight as evidence of the affordability crisis. That rise is, in large part, the consequence of choices made in 2010 about the structure of the individual market. The affordability crisis in ACA premiums is the consequence of an affordability policy.
In 2021, the American Rescue Plan dramatically expanded premium tax credits as pandemic relief; the IRA in 2022 extended the expansion through 2025. Marketplace enrollment more than doubled, from 11.4 million to 24.3 million, with 92 percent of enrollees receiving the enhanced credits. Insurers priced into a market organized around those subsidies. Consumers chose plans they would not have chosen without them. When the enhanced credits expired at the end of 2025, the average annual marketplace premium payment roughly doubled, from about $888 to about $1,900, according to KFF. A couple at 402 percent of the federal poverty level—the cliff the expansion had smoothed—could see their annual premium rise from 8.5 percent of income to roughly a quarter of it. The subsidy was expanded. The market reorganized around it. The subsidy was withdrawn. The “affordability crisis” in 2026 ACA premiums is, in significant part, the affordability policy of 2021 completing its arc.
Housing, by contrast, remains the most awkward case for both sides. Federal housing policy since the 1930s—the GI Bill mortgages, FHA, Fannie and Freddie, the mortgage interest deduction, the low-income housing tax credit, Section 8 vouchers, the Community Reinvestment Act—comprises a vast, bipartisan effort to push housing toward affordability. The cumulative subsidy likely totals tens of trillions in present value across the postwar era. And the result is that housing in productive metros costs more relative to income than at any time in living memory.
The reason isn’t a mystery. Essentially all of these programs subsidized demand for housing while local zoning rules constrained supply. Subsidies that meet a fixed supply capitalize into land prices. Edward Glaeser and Joseph Gyourko have spent two decades documenting this. The YIMBY movement rests on this insight. And the affordability discourse, again, cannot bring itself to say it aloud, because acknowledging it would require admitting that the main obstacle to housing affordability in America is the median voter in the most desirable places.
Childcare is the newest and least-subsidized of the major categories, but early evidence is moving in the same direction. The Child Care and Development Block Grant was created in 1990 and has been expanded several times. The American Recovery and Reinvestment Act of 2009 and the American Rescue Plan Act of 2021 injected tens of billions more. States with the most generous childcare subsidies—New York being a leading example—have seen prices rise the fastest. Like housing, childcare faces a heavily constrained supply: State rules on staff-to-child ratios, group sizes, and worker credentials meaningfully limit how many centers can operate. Multiple studies find that tightening the infant ratio by a single child reduces the number of centers in a given market by about 10 percent, with closures concentrated in lower-income areas. Childcare in the most-regulated states costs more than twice what it does in the least-regulated ones. So when subsidies boost demand, supply cannot respond.
Now observe the pattern. The categories that have absorbed the most public money to improve affordability—higher education, healthcare, housing, and, increasingly, childcare—are precisely the categories where affordability has worsened, sometimes catastrophically. The categories where we have done relatively little—food, clothing, electronics, telecommunications, most consumer goods—have become markedly more affordable in real terms over the same period. A 1985 long-distance call to Europe could cost more in nominal dollars than a month of unlimited mobile service in 2025 that includes a supercomputer in your pocket.
If you want to visualize this entire pattern in one image, consider the chart Mark Perry of AEI has updated for years, the so-called “Chart of the Century.” It plots U.S. price changes from 1998 onward across 14 categories. The categories with the steepest rises—hospital services, college tuition, college textbooks, medical care, and childcare—are the heavily subsidized, supply-constrained ones. The categories whose prices have fallen or remained flat—TVs, toys, software, and cellphone service—are the ones with little subsidy, robust supply response, and exposure to global competition. New cars and clothing, contrary to the common complaint, have remained roughly flat in nominal terms for a quarter-century while wages rose by about 80 percent or more—meaning they actually became cheaper in real terms. The pattern is so clean it looks engineered to illustrate the point.
We are not alleging that correlation proves causation. But this goes far beyond correlation. The data show this dynamic across every category that fits the combination, and the opposite in categories that do not. We contend that anyone arguing for simply spending more on the affordability problem bears a heavier burden of proof than is usually asked. The track record of the standard policy menu—more subsidies, more forgiveness, more aid—is the same reflex that generated the very inflation it aimed to alleviate in the first place.
Why the fog is useful.
If conflating everything is so destructive, and the policy history so unflattering, why does the affordability discourse persist in its current form? Because the fog serves a purpose. To different audiences, in different ways.
Democrats point to the 49 percent figure and advocate childcare subsidies, student-loan forgiveness, and ACA expansion. The less affluent receive rhetorical attention, the upper-middle class gets the dollars, and prices keep rising. It is a remarkable policy feat: Each intervention justifies the next, even as the underlying conditions worsen for everyone except the producers of the subsidized service.
Republicans cite the same figure and push tax cuts and deregulation. These primarily aid asset owners and the squeezed-talent class; they do little for the destitute tail: the capital-gains rate does not bind a Mississippi single mother, and the estate-tax exemption does not secure a job for an unemployable-for-profit graduate. And this is what Republicans used to do. More recently, they have added tariffs and selective industrial policy. Tariffs act like a direct tax on the consumer goods the destitute tail buys; the worse a household’s situation, the larger the share of its budget gets taxed. To call this an affordability policy requires an Orwellian looseness of language.
Why is a flat-screen TV affordable and a college education not? … The answer is not a coincidence, and it is not because flat-screen TVs are easier to make than college degrees. It is because Congress has spent 60 years trying to make college affordable and has spent zero years trying to make TVs affordable.
The poor lack lobbyists, but they have activists, and those activists are often more influential than lobbyists. The middle class has union leadership and institutional advocates who also trump lobbyists. The fog of affordability is convenient for all of these actors because it allows them to claim they are tackling a single homogeneous crisis while pursuing policies aimed at their own constituencies.
The fog is also a convenient way to avoid confronting the policy history. If you accept that the 49 percent figure describes a single homogeneous problem, you do not have to ask why the categories we have spent the most on have worsened. You can simply propose more of the same. If you separated the problems and faced the track record honestly, you would have to ask much tougher questions—and the answers might require betraying parts of your coalition. It’s easier to keep the fog in place.
What honest stats would look like.
If we were to describe American affordability honestly, we would do a few things differently from the Urban Institute’s tracker.
You would use separate denominators for distinct problems. Childcare prices matter to the roughly 15 percent of households with young children who use center-based care at market rates. Reporting childcare price growth as if it affects all Americans is numerically unsound.
You would separate stocks from flows. The 81 percent home-price increase since 2017 describes the situation of would-be first-time buyers, who represent about 5 to 10 percent of households each year. Existing homeowners—roughly 65 percent of households—are locked into sub-4 percent mortgage rates and have seen their housing costs fall in real terms. These are opposite stories, not one story.
You would distinguish severity from prevalence. A statistic that combines the destitute tail with the discretionary grumblers in a single figure tells you nothing about either group.
You would separate self-imposed costs from those that are imposed. Someone who chose to take on $200,000 in debt for a degree with predictable low earnings is in a different situation from someone who was fraudulently harmed. Lump them together as “student-debt burdened” is unfair to both.
You would consider policy counterfactuals. What would tuition look like today if federal loan limits had not been raised since 1985? What would coastal housing look like if zoning had been liberalized 20 years ago? You do not need precise answers, but you must acknowledge that these questions exist.
And you would compare across categories that have both been heavily subsidized and not. Why is a flat-screen TV affordable and a college education not? Why is a smartphone affordable and a hospital stay not? The answer isn’t a coincidence, and it isn’t because flat-screen TVs are easier to manufacture than college degrees. It’s because Congress has spent six decades trying to make college affordable and has spent zero decades trying to make TVs affordable.
In closing.
The affordability crisis is real. A meaningful portion of Americans endure genuine, catastrophic distress and need assistance. A larger share of talented young Americans are being forced out of the lives their parents enjoyed. Both groups deserve serious consideration. Neither is well served by being lumped into a single statistic alongside people who are upset about streaming bundles and $16 salads. Holding both positions at once is difficult but essential.
The lumping-in allows the affordability discourse to keep recommending the same policy menu that, category after category, has worsened the underlying problem. It’s what enables both parties to claim they are addressing a crisis while pursuing policies aimed at different populations. It is what allows everyone to skip the awkward question of why, after 60 years of subsidies, the items we subsidized became more expensive while the items we did not subsidize became cheaper.
If you want to take affordability seriously, you must dissect the number. You must ask which problem you’re solving. You must ask what has been tried before. You must ask why prior attempts failed. And you must be ready to hear answers that do not flatter your priors, because none of the answers in this space flatter anyone—including, in more than one respect, us.
Until then, the next person to tell you that half of Americans can’t afford to live is delivering a wrong number. They may not know it. The number itself speaks plainly.

")